
Standard Deviation, Variance, Fluctuation, FFG Median, FFG Deviation, Mean Average, Sum
By Ion Saliu, Fundamentally At-Large

This Web site is the official and only host of the famed Fundamental Formula of Gambling (FFG). The Fundamental Formula of Gambling is, by far, the most precise and useful instrument in stochastic, or random, or probabilistic events. Nothing in theory of games is more significant or more precise than FFG. The Fundamental Formula of Gambling calculates one very descriptive parameter: the FFG median. Each and every random event repeats, in at least 50% of the cases, after a number of trials less than or equal to the FFG median.
There is a significant number of Internet searches related to: fluctuation, variation, or standard deviation in random phenomena. Fluctuation or variation can be measured by several methods. The most common method measures fluctuation in rapport to the mean average of a data series. The elements of a data series vary from the average by positive or negative quantities. The method leads to the well-known standard deviation.
The Fundamental Formula of Gambling leads to another precise instrument: the FFG deviation. I found it to be significantly more precise and useful than the standard deviation. The standard deviation is viewed as: 1) a statistical parameter of a numerical series; 2) a probability parameter of binomial events.
1) The statistical standard deviation is calculated as the square root of the variance; the variance is the average of the differences from the mean of the series. A data series like 1, 2, 3, 6 has a mean equal to (1+2+3+6)/4=3. The differences from the mean are: -2, -1, 0, +3. The variance is the measurement of such differences. The variance is calculated as: {(-2)^2 + (-1)^2 + 0 + (3^2)}/4=14/4=3.5. Finally, the standard deviation is equal to the square root of the variance: SQR(3.5)=1.87.
One serious problem with the standard deviation as an analytical tool: It is distorted by extreme values (extremely high, or extremely low) in the data series.
2) The binomial standard deviation applies to events with two outcomes: win or lose. For example, betting on heads in coin tossing can lead to win (the appearance of heads) or loss (the appearance of the opposite; tails, in this case). The binomial standard deviation is calculated by the following formula:
Standard deviation = SQR{(N*p*(1-p)}
where p is the probability of appearance and N represents the number of trials.
Suppose we toss a coin 100 times (N=100). The probability of heads is p=1/2=0.5. The standard deviation is SQR{100 * 0.5 * 0.5} = SQR(100 * .25) =SQR(25) = 5. The expected number of heads in 100 tosses is 0.5 * 100 = 50. The rule of normal probability proves that in 68.2% of the cases, the number of heads will fall within one standard deviation from the number of expected successes (50). That is, if we repeat 1000 times the event of tossing a coin 100 times, in 682 cases we'll encounter a number of heads between 45 and 55.
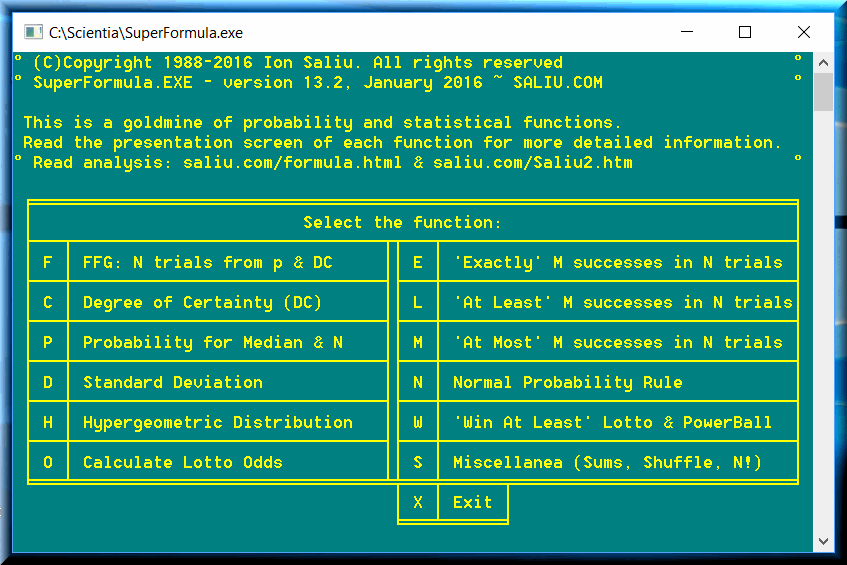
This Web site offers great freeware to do a multitude of calculations on the topic of the Fundamental Formula of Gambling, plus theory of probability, and statistics.
Two programs stand out: FORMULA and SuperFormula. FORMULA is 16-bit software, now superseded by SuperFormula, 32-bit probability and statistics software.
This is the definitive and the ultimate probability, gambling and statistical software. Among many functions, the program can take a data series and calculate the sum, mean average, standard deviation, median, minimum, and maximum.
Here is an example of a data series saved in a lotto 5/39 game file (Pennsylvania lottery Cash 5):
The Sum of 13,825 numbers in \LOTTERY\PALOTTO-5 is: 276,423
Mean Average: 19.99
Standard Deviation: 11.29
Median: 20
Minimum: 1
Maximum: 39.
The data file can be created easily in any text editor, including MDIEditor Lotto WE. The file can have uneven lines; i.e. variable numbers of items per line. Or, the data file can consist of one huge column; i.e. one number per line. The numbers can be separated by spaces, commas, tabs, or Enter. You can also export data from spreadsheets or databases to text files.
Fluctuation (variation) can be measured by another method: chi-squared distribution. In this case, the terms of a data series are accompanied by the frequencies of the respective terms (elements). The frequencies are compared to the expected (theoretical) frequency. For example, in a lotto 6/49 game the expected frequency of any number in 100 drawings is:
(6 / 49) * 100 = 12.24.
Deduct the frequencies of every number from 12.24 to determine the chi-squared independence.
I prefer the normal probability rule to determine the independence of a data series. Let's use the same example of 6/49 lotto game. The degree of certainty is equal to 99.8% that every lotto number will have a frequency between 2 and 22 in any 100 draws. That is, 3 standard deviations from the expected frequency of 12.
Roulette is a totally different game.
In the case of an event of probability p = .02631579 (1/38) in 100 trials:
The expected (theoretical) number of successes is: 3
Based on the Normal Probability Rule:
· 68.2% of the successes will fall within 1 Standard Deviation from 3 - i.e., between 1 - 5
·· 95.4% of the successes will fall within 2 Standard Deviations from 3 - i.e., between -1 - 7
··· 99.7% of the successes will fall within 3 Standard Deviations from 3 - i.e., between -3 - 9.
Real-life roulette spins will show that some numbers do not come out in 100 spins. There are situations when a roulette number is not drawn in over 200 spins!
The normal probability rule indicates a very important factor: What is the minimal number of trials to meet a degree of certainty (or a level of confidence)? In the roulette case, 100 spins are not sufficient to meet a 95% degree of certainty. Negative values for the lower bound mean that the level of confidence cannot be satisfied. The maximum satisfied is 88.15%.
In the case of an event of probability p = .02631579 (1/38) in 100 trials, 88.15% of successes will fall within 3 standard deviation(s) from 3; i.e. between 1 and 5; the standard deviation is: 1.60073.
