
Odds of Powerball or Mega Millions Jackpot Winner Relative to Sales or Number of Tickets Sold
By Ion Saliu, Founder of Lottery Mathematics

First capture by the WayBack Machine (web.archive.org) August 10, 2013.
On November 28, 2012, the Powerball jackpot reached a record $590 million. A frenzy! The jackpot had rolled over several times. The question becomes: What are the odds that at least one ticket will win the Powerball jackpot relative to the amount of prize money? Similar questions pertain to the Mega Millions and Euromillions games.
The methodology that follows applies to any jackpot lotto game, regardless of format. It requires one parameter only: number of tickets sold over the rollover run. Total number of tickets sold is determined by total sales, and then from total prize money (usually 50% of total sales). The figures for the very next draw of the rollover stretch are estimates or projections.
We can look at the question from three perspectives:
A. Axiomatic one, we work with guestimates here. We base our method on the projected jackpot value. That's money, and we can't calculate odds or probability based on money. We try to derive the estimated number of tickets sold during this rollover run.
We know another important fact. Usually, the amount of the jackpot represents 68% of prize money. Thus, we divide the estimated jackpot value by 0.68: 590,000,000 / 0.68 = $867,647,059 aggregated prize money.
One more step is required. The prize money represents only half (50%) of total sales. Only total sales indicate the number of tickets sold. 867,647,059 * 2 = 1,735,294,118.
Finally, we know that a ticket costs $2. Therefore, 1,735,294,118 / 2 = 867,647,059 tickets sold over this rollover streak. Sure, it is an approximation. Usually, the figures go higher due in large part to publicity.
Now, we are ready to apply the Fundamental Formula of Gambling (FFG):
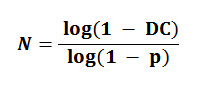
DC represents the degree of certainty that an event of probability p will appear within a number of trials N.
DC is the essential element here. We apply the function C = Degree of Certainty DC running my probability software SuperFormula (component of the scientific software package Scientia). The unique software is used by everybody doing this type of calculations.
We have the following elements:
p = 1 / 175223510 (the Powerball jackpot odds at that time; 175,223,510 represents total number of combinations in the game)
N = 867647059 (the number of tickets represents N in FFG).
Doing the calculations, we get the most accurate result:
DC = 99.3%.
That was the chance that at least one ticket would hold the Powerball jackpot combination for the above amount of prize money or total tickets sold in the rollover stretch.
And, lest we forget, there is NO absolute certainty, or DC = 100%! Absolute certainty is absolute absurdity in mathematics. Yes, a rollover can go on like forever. Maybe not ad infinitum, but ad nauseam for sure!
B. The odds to hit the jackpot in Powerball/Mega Millions/any lotto in a particular drawing require the number of tickets to be played in the draw. There are websites that make such estimates. Of course, after the drawing, some websites publish allegedly accurate figures regarding the number of tickets sold.
Some experts consider this calculation to be the most precise. After all, the lottery drawings are independent from one another. It doesn't matter what happened in the previous drawings in this rollover run. Maybe the winning combination in this drawing was played in previous draws, but not now. Only tickets played in this draw count.
Strictly mathematically speaking, there is limited truth in this theory. It explains, to some, why there are so many rollovers. For example, Powerball experiences rollover runs when more than 292,201,338 tickets were sold without a jackpot winner.
In the case of 292,201,338 tickets sold in Powerball 69/5/26/1, DC is 63.2%. In the case of 302,575,350 tickets sold in Mega Millions 70/5/25/1, DC is also equal to 63.2%. This probability rule is known as Ion Saliu's Paradox.
On the other hand, I don't think you'll see a rollover streak when 5 billion tickets were sold and there was no jackpot winner! The past does count, methinks!
Many experts consider this the most accurate method of calculating the odds of a jackpot win based on the number of tickets sold. Methinks this assessment is true precisely for the first draw before any rollovers.
However, there were several drawings before the jackpot is hit. This method closely resembles the gambler's fallacy. I call it the Wizard of Odds syndrome. "No matter how many times you'll toss the coin, the probability of, say, heads, is always 1/2. Naturally, you can lose 200 consecutive tosses, as well as heads can come out 200 tosses in a row! As simple as that, burning man!"
They don't look at the process dynamically. It is a multiple event. They ignore the third fundamental element of probability: degree of certainty, DC. Indeed, the probability of heads is always 1/2 (0.5, or 50%). But the degree of certainty of 5 consecutive heads is very different from the degree of certainty for 200 consecutive heads. Generalizing further:
Just a sample of dynamics in probability.
C. We deal with a mathematical situation known as probability of M successes in N trials, where N ≥ M.
The SuperFormula.exe software can also perform the calculations employed by this method. This probability rule and FFG reach the same result for the case of at least one success in N trials.
So, there is a rollover reaching 10 draws (an example here). We know how many tickets were sold per total. Let's consider an average number of tickets played. We calculate the average DC based on FFG. That is the probability we use to calculate at least one success in N trials. In this example, at least one jackpot ticket in 10 lottery drawings.
In case A, we determined the number of total tickets sold in 10 lottery drawings: 867,647,059. We need to calculate the average amount of tickets sold: 867,647,059 / 10 = 86,764,706 tickets per draw. Next, what is the average degree of certainty? We run again Super Formula with the new parameter:
p = 1 / 175223510
N = 86764706
Doing the calculations, we obtain the average degree of certainty:
DC = 0.391 (39.1%).
We work with this value to determine probabilities of multiple successes in several trials. The most important calculation is done by function L = At Least M Successes in N Trials in that piece of grandiose software.
Axiomatic one, let's compare the three methods. We take a game that's easier to calculate and figure out: roulette. The probability: p = 1/37.
In method A, people played independently (online) several spins. Total numbers played during the run: 260. The degree of certainty that the winning number will come out: DC = 99.9%.
In method B, people played independently (online) several spins. Total numbers played during the run: it doesn't matter. What matters now is how many numbers were played in this particular spin; e.g., 26. The degree of certainty that the winning number will come out in this spin: DC = 51%.
In method C, people played independently (online) 10 spins. Average amount of numbers played during the run: 26 (a total of 260 numbers). Average degree of certainty: 0.51. The probability of at least one success in 10 trials: 99.9%. The keyword here is at least.
There can be more than one winner. How about at least 3 winners (players) in 10 spins? DC = 95.2%. And how about exactly 2 winners (players) in 10 trials? DC = 3.9%. How 'bout at most 5 winners (players) in 10 spins? DC = 59.8%.
I betcha millions, you won't witness 10 roulette spins without a winner, if an average of 26 numbers per spin are played. I mean, in your lifetime (because you won't spend your entire life inside a casino!)
I consider the method C the most solid mathematically. Probability is dynamic, not static. The other two methods do not consider multiple jackpot tickets in the same drawing but such a situation occurs more often than not in rollovers. As seen above, you can calculate the odds of at least 1, or 2, or 3, etc. jackpot winning tickets in that particular drawing.
Still, methods A and C lead to the same result for one winner in the draw. That's so because in FFG the at least qualifier is implicit.
"People who believe in gods
Are mighty frightened by the odds
But I give them software
To beat the odds with fanfare."
Resources in Powerball, Mega Millions: Software, Strategy Systems, Wheels
See a comprehensive directory of the pages and materials on the subject of lottery, lotto, software, systems, strategies, wheels.
Home | Search | New Writings | Odds, Generator | Contents | Forums | Sitemap